


It is vitally important, especially if you are driving paid traffic, that you pay attention to your visitor’s on-site behavior to help improve your results. Your visitors are what drives your business and if they are met with friction getting what they want they will quickly leave your site without taking a desired action.
Today we are going to look at a specific example of the use of heat and click maps to get a better understanding of visitor behavior and how making changes based on this data can improve your results.
This particular example looks at a site where there are multiple products being offered or a “products” page.
In this case, the site listed 30 various products (on the products page) in 4 main categories across the top of the page.
We installed Crazy Egg to gather some intel on the page to see if there was some friction at all and to set us up for some tests on what is one of the more highly trafficked pages on the site.
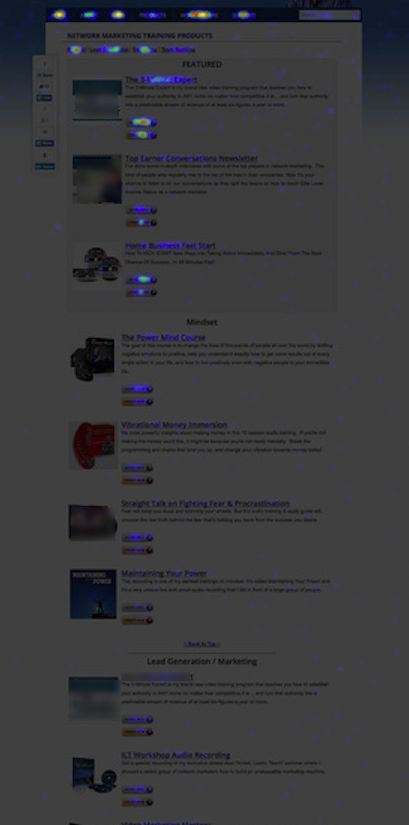
Above is the click map data collected for the page. As you can see the further you go down the page the fewer clicks are actually happening which means those products are basically not getting seen.
The top 4 products are the ones that are clicked on most and out of the 4 categories listed, ONE of them was clicked almost 10 times as much as the others. If you also look at the menu bar there is one area that is “white hot” which means it is clicked on by the majority of the visitors. This link was a link for consulting.
![]()
To confirm that the majority of the products on the page aren’t seen or aren’t being clicked on, you can see the heat/scroll map.
As you scroll down the page there is less and less activity. Sort of common knowledge that you need to maximize above the fold of the page and this confirms it.
So what do you do with this data?
Visitor demand points us in the direction of two main categories at the top of the page. Turning focus onto the products in these categories can help visitors get more of what they want, remove friction, and increase the results they are looking for on the page.
As expected and proven with the scroll map, most people don’t scroll to the bottom. Placing the highest value products near the top will in turn increase results and generate more revenue long term.
We recommended that they drop some of the less desirable products from the page and promoting them in other ways to put more focus again on the highest value products.
Lastly, we recommended taking advantage of the “Consulting” link clicks by improving the offer they see once clicked on that specific page.
We don’t have specific test results for this particular page based on this data yet but this gives us a good start on how to increase engagement, lead generation, revenue, and maximizing all the traffic that lands on this page.
The big question is… are you paying attention to how your visitors interact on your site or are you flying blind, assuming you know what they want?
We have seen this in many cases whereby following the data such as listed above gives us better insights and allows us to give the visitors more of what they want and confirm the increases through split testing.
If you aren’t tracking heat and clicks you should be.
If you found this article to be beneficial, be sure to like, comment, share, and subscribe.
If you want a 3rd party view of your site to see where you may have some other bottlenecks, be sure to reach out for a complimentary site review.